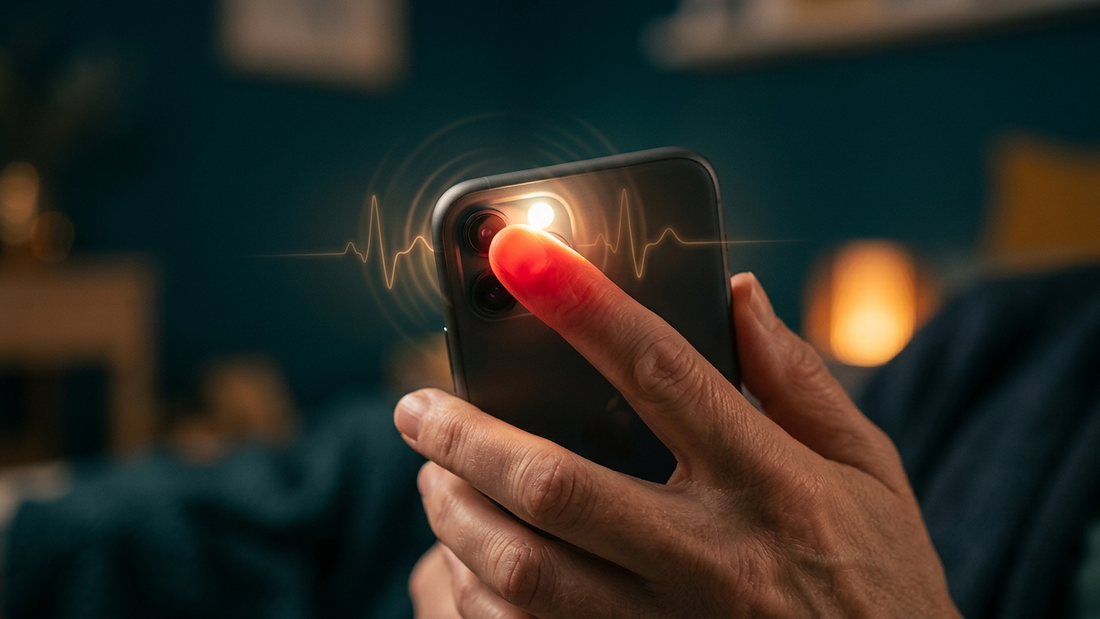
Rest a fingertip over your phone's rear camera. Tap start. The flashlight comes on, dim and steady, and for sixty seconds you keep still. That is the entire ritual — and at the end of it you have your heart rate, and something considerably more interesting: your heart rate variability.
What the camera is actually seeing
Your fingertip is translucent. Shine a light through it and some of that light reaches the camera sensor on the other side of the tissue. Every time your heart beats, a pulse of blood arrives in the capillaries of your finger and absorbs slightly more red light. The image gets a fraction darker. Then the blood drains and it gets a fraction brighter again.
That rhythm is your pulse, written in brightness. The technique is called photoplethysmography — PPG — and it is the same physical principle behind the green lights on the back of a smartwatch.
The catch is the word fraction. The pulse signal is less than one percent of the total brightness of the frame. Which is why the hard part is not reading the pulse. The hard part is everything the phone does by default that destroys it.
The engineering that makes it work
A phone camera is built to make photos look good, and every one of those instincts is hostile to this measurement:
- Auto-exposure is the enemy. Left alone, the camera notices the frame getting darker with each heartbeat and helpfully brightens it back up — erasing the exact signal we came for. So the moment your finger makes contact, MyUltra.Coach locks exposure, white balance, and focus and refuses to let them move for the rest of the minute.
- Frame timing has to be real. Every sample is stamped with the camera's own presentation timestamp, never a frame counter. If a frame is dropped, we need to know it was dropped rather than quietly assume the beats were evenly spaced. Fake regularity would show up as fake calm.
- The torch has to be gentle. Too bright and it saturates the sensor and warms your finger; too faint and the signal disappears into noise. Getting this right took several rounds of tuning against real captures.
- Contact is detected by colour, not brightness. A finger on the lens turns the frame deeply red. We check the *ratio* of red to green and blue rather than "is it dark," because a dark frame can just as easily mean a pocket.
Under good conditions, a capture records over seven thousand frames — roughly 120 per second — of clean, exposure-locked data.
From brightness to beats
The raw trace then goes through real signal processing:
- Drop the first two seconds while the torch and sensor settle.
- Resample to an even 250 Hz timebase.
- Band-pass filter between 0.5 and 8 Hz, applied forwards and then backwards so the filter introduces no phase shift — no smearing of when a beat happened.
- Find each beat with an adaptive threshold that scales to the local signal envelope, then refine each peak to sub-sample precision by fitting a parabola through it. Beat timing to the nearest frame is not good enough; the whole measurement lives in the milliseconds *between* beats.
- Screen the intervals. Anything that fails a rolling-median test, or jumps implausibly from its neighbour, is thrown out.
That last step matters more than it sounds. A twitch of your finger produces a bump that looks a lot like a heartbeat, and a phantom beat inflates your variability — making a stressed reading look wonderfully resilient. When an interval is rejected, we do not simply stitch the gap closed and carry on; the differences either side of it are excluded too, because a difference measured *across* a discarded beat is not a real one.
What you get back
- Heart rate in beats per minute
- RMSSD — the beat-to-beat variability most closely tied to parasympathetic activity, the "rest and digest" side of your nervous system
- SDNN and pNN50 — two further standard views of the same variability
- Signal quality — perfusion, periodicity, and how consistent the shape of your beats was
If quality is poor, we say so and ask for another go. A bad reading recorded as a good one is worse than no reading at all.
How we know it is right
Every version of the analysis is run against synthetic pulse signals with known ground truth — waveforms where we already know the exact heart rate and exact variability, so the code either recovers them or it does not. The tests hold it to within about a beat per minute on rate, and to tight tolerances on RMSSD across slow, resting, and fast heart rates.
One test matters more than the rest: a perfectly metronomic signal, with zero true variability, must come back reading close to zero. It is very easy to build a pipeline that manufactures variability out of noise and sub-sample jitter. That test is the one that stops us shipping a number that feels good and means nothing.
We also keep real captures on file and replay them through every change, and iOS and Android are held to the same numbers rather than each drifting into its own dialect.
To be straight with you: this is careful engineering against known-truth signals, not a clinical validation study. Treat it as a well-built consumer measurement — excellent for tracking *your own* trend over time, which is what it is for.
One reading tells you very little
Your HRV moves with sleep, hydration, caffeine, alcohol, posture, illness, and the time of day. A single number in isolation is close to meaningless, and any app that hands you one and implies otherwise is selling you something.
So MyUltra.Coach does not show you a raw score against some population average. It builds your own rolling baseline over the previous month and then tells you, in plain language, where today sits relative to your normal — in line with it, a little below, notably above. It stays quiet until it has enough readings from you to have a genuine opinion.
That is the honest version of this measurement, and it is the one worth having.
It is free
Not free-trial free. Not free-with-an-upgrade-prompt free. Make an account and fingertip HRV is yours, along with the rest of your record. Paid plans exist for people who want more time in live coaching conversations — the measurement itself is not the thing we would ever put behind a paywall.
Get the app and take your first reading tonight.